One of my all-time favorite trading tools is Fibonacci Retracement. While most of you already know what this tool is and how it works, I want to give a quick crash course to those who don’t understand the basics. Pardon me for making it boring for those who know about it, but this is meant for those who are trying to learn the ABCD of Fibonacci.
I will not get into the details of Fibonacci in Nature etc because you can find most of that on the INTERNET anyway. Let’s focus on Fibonacci Retracement for Finance.
I won’t get into the History of Money or Fibonacci and how it came into relevance for financial assets, but I want to focus more on Current Market Dynamics.
So here is how the modern market works. We have 4 different entities.
- Underlying asset ( for example Stock / Currency / CryptoCurrency)
- Broker / Exchange (The market place where Buyers & Sellers can BUY & Sell their underlying assets)
- Market Makers (Once an Asset is listed with Broker / Exchange, Market Makers provide two-way quotes. They buy & sell all the time in order to make that asset liquid enough)
- Investors / Traders (Essentially you and me or hedge funds, pensions funds, etc)
Now Exchange / Brokers are supposed to do their own due diligence before they allow an asset to be listed with them in order to be traded. Once an Asset is listed or traded, a specific set of Market Makers starts providing two-way quotes (buy essentially buying & selling all the time). The Market Makers make their money out of the BID / ASK Spreads as well as by taking positions periodically and offloading those positions periodically.
Market Makers come in all sizes, shapes, and forms. For Example, the Foreign Currency Market has 5 Trillion Daily Volumes and the biggest market makers are some of the largest banks in the world. Similarly, for Stocks, plenty of quant funds which are essentially owned by Large Investment Banks as well as Hedge Funds provide liquidity. (If you are unsure of whats liquidity, I will write a separate article on that topic)
In Crypto Markets, in many cases (in most cases we can say) the Liquidity is provided by Exchanges themselves through their own in-house Market Making Desks or through external Market Makers (You call them Whales). for Example, Bitmex is known to have an active Market-Making Desk which provides almost unmatched and unlimited liquidity. What does that mean? Well, it means you can buy Millions of Dollars worth of Bitcoins sometimes at a single price. When you are buying, they are selling it to you & when you are selling they are buying it from you. They act as a counterpart on the other side and take a trading position to help you trade.
The Logic behind providing Liquidity is to create a Market Place where Buyers and Sellers can trade against each other and if normal people like you and me are not interested in buying or selling, the Market Makers comes into play and Buy or Sell and provide the liquidity to allow the markets to function normally.
Now, most of the Market Makers use Semi-Automated or 100% automated trading bots to “Make Market & Provide Liquidity”. In a 24/7 Market, where one Market Maker may be quoting prices across hundreds of assets, it’s virtually impossible for them to manage billions of dollars worth of business manually. That’s essentially good news for us as retail traders. Why? Because we are trading against the bots, in most cases we can crack the logic behind those bots, and create trading strategies around them & make some fantastic profits from it.
Most Market Makers use the same tools as us to make sure we all remain interested in the game and play it long enough. Their Basic Bread Butter tools include:
- Support & Resistance which are in turn based on
- Trend Lines & Horizontal Zones
- Moving Averages (Both SMA & EMA)
- Ichimoku (Some Market Makers use it)
- RSI & MACD
- And Fibonacci Retracement (Almost all of them use it)
Now since the bots are programmed to follow these tools, in almost every case, they will respect these levels irrespective of the day of the week or time in the night. Humans can’t do such calculations with so much efficiency for 24 hours & 7 days for hundreds of assets. Most Bots are programmed for confluence Trading which means an area or zone of Support & Resistance Levels based on some or all of the tools being applied by the automated bots. Like you and me, Bots also need entry, stop loss, targets logic based on certain liquidity benchmarks for Market Makers.
For Example, if there is a huge selling in the Market & based on historical analysis if the Market Makers are not comfortable buying your positions, they will withdraw the Liquidity from the market which will push the prices to plunge down in a free-fall manner. Similarly, if there is too much demand and if they chose not to supply, they may withdraw from the sell-side, allowing the prices to jump. But in both cases, the Bots are programmed to respect levels for reversal.
Since our counterparties are bots, it’s not that difficult to eventually overcome their logic and patterns to understand how they are programmed and what will they do next. In fact, the past historical data can give you some clues about how they behaved in the past and give you some hints for the future. For Example, Bitcoin always respected 70.6% Fib while going down (And Litecoin & ETH mimicked it in some cases). While most people were looking to trade 78.6% Fib, the Market Makers used an intermediate level to reverse the trend.
Enough of the background on Market Makers & how they manage the markets currently. Let’s move onto the ABCD of Fibonacci Retracement.
If I have to explain this tool to a Layman then here is how I will do it. Assume the price of your House currently is 100,000
Now suddenly there is a lot of demand and price jumps to 200,000. In % Terms, the Price jumped 100% in value. Now if the Price Drops from 200,000 to 150,000, we lost 50,000 in gains. Our original gain was 100,000 out of which we lost 50,000, that is 50% = 50% Fibonacci Retracement. In Nutshell if your gain was $100 and then prices fall and now you are left with only $40 gains that mean you lost 60% of original gains = 60% Fibonacci Retracement.
Here is why Fibonacci works the way it works. Market Maker running the automated bots use Fib retracements like 23.6%, 38.2%, 50%, 61.8%, 78.6% as Support & Resistance Levels, and do a lot of ping pong trading between these levels. Now, these levels are not relevant for us in most cases in the prices don’t move much. for example, your house price moves from 100,000 to 101,000, its pointless to see that as an opportunity for someone else to come and buy it hoping he can make some quick bucks.
However, The game becomes interesting when the Price jumps from 100,000 to 200,000 Now a lot of new investors will want to buy your home for quick profits if the price comes down to 140,000-160,000 Range. They will buy around that price hoping that someday the price will go back to 200,000 or even more and they can profit. While you may choose to sell at 150,000 because A: you might have bought it at 30,000 originally or that you are scared that prices will drop back all the way to 100,000 and that you will lose on the gains.
So Trading based on Fibonacci Retracement becomes absolutely interesting when there is a big impulse move (Up or Down). After the impulse move, the price holds a certain range as support. For example, Bitcoin Price jumps from 1000 to 3000 & drops back to 1800-2000 Area and holds that than that makes it a very interesting play for market participants. If the trend continues, we can make tons of money on the upside.
When is Fibonacci Retracement most effective?
Clue # 1 The best time to use Fibonacci is when you see big impulse moves & price respects the Fibonacci levels around 40%-60% retracement area (Respect means, for example, the price goes up to $100 and come down by 40-60% and doesn’t drop further). Let me repeat big moves are going to make your life so much easier vs smaller moves and therefore always look for and hunt for big movers
(Trading Room offers real-time monitoring of impulse moves in different time periods. for example, we track big moves in 6 Hours, 12 hours, 1 Day, 2 Day, 3 Day, 7 Day, 15 Day, 30 Day, 100 Day, and even 500 Day Periods. Check Trading Room Price Action Page here to see the big impulse moves. We also track Fibonacci Retracement in real-time to show you how much the Price jumped in that period and how much it dropped back.)
Clue # 2 Look for the past Price Action of the last 50 Days. If the Price was in a large consolidation zone for a long period of time & is now breaking out then this will be your dream entry. But if the Price already pumped earlier and dumped again and this is the second big move up then this will make money for you but not as much as the first move.
In most cases, the big impulse moves will make you money (We are talking about mainstream assets like Bitcoin / Ethereum / Litecoin or any other major assets. Don’t apply Technical Analysis Logic on most microcaps / small caps Crypto or even stocks. Their price moves mainly on the basis of the sheer pump and dumps abilities of the Market Makers behind those coins considering they are not liquid and they don’t attract regular traders like you and me)
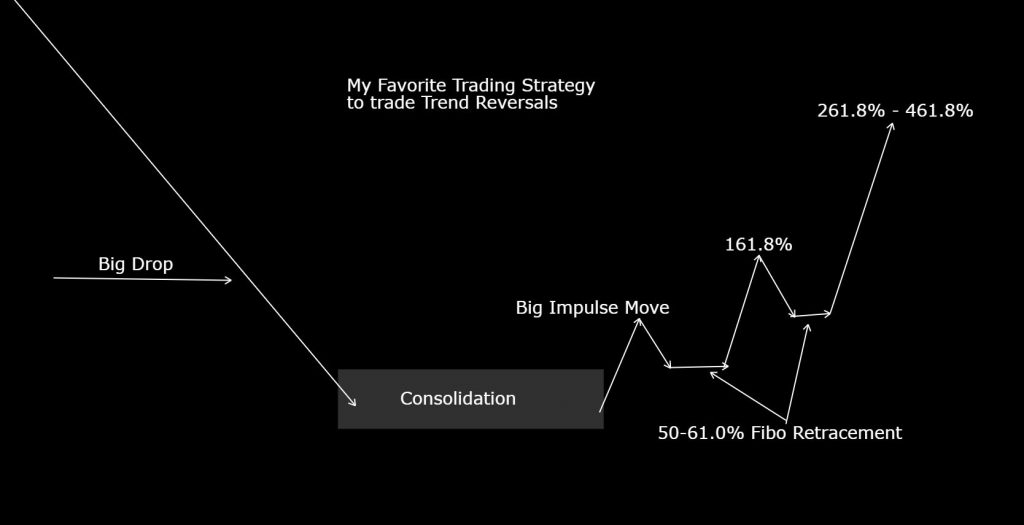
Clue # 3 for Big impulse moves happening for the first time after a long period of consolidation, we can target 161.8% Extension as bare minimum Profit Target with 261.8% and 461.8% as potential extensions. Now, what does 161.8% means? Again in layman’s language, if your house price rose from 100,000 to 200,000 & dropped back to 150,000 = it lose 50,000 in value. Now it has a potential to rise again by 1.61 x 50,000 = $80,500 Which means the buyer who bought from you at 150,000 will want to target his sell price around 150,000 + 80,500 = $230,500
Fibonacci Retracement – Profit Targets:
- Keep it simple, If you join the Trend when it’s at the beginning, Target 161.8% – 261.8 % – 461.8%
- Measure How Much the Prices rose and How much they fall and based on that make 1.61 times, 2.61 times of 4.61 times of the Fall Value as Potential Profit Targets
- If you join the trend mid-way than don’t target more than 161.8% – 361.8% Area
- If you are joining at the fag end of the trend, then target only 61.8% or 78.6% Area
My Favorite Trend Reversal Strategy based on the current market conditions as the following one. I prefer to trade Daily Timeframe and H4 as an entry for this strategy
To know more about Fibonacci Retracement, please also check the video recording of the LIVE Webinar Training from @ChingasX He has done a phenomenal job explaining the details in the video. Check the video here
Legal Disclaimer: All Information & Technical Analysis Modules are based on Proven Tech Analysis methods and strategies. However, as always do your own research before taking any trading positions based on any online or social media posts including ours
Nice sirs love your content. What I learned from experience is using pictures/graphs more often. Text is very useful to give a picture more context.
Nice sirs love your content. What I learned from experience is using pictures/graphs more often helps in better understanding. Text is very useful to give a picture more context.
Another absolutely fantastic article! Thank you so much for this. The example using the house was very clear and simple to understand!
MUST READ FOR NEW TRADERS….LOVE THE WAY YOU EXPLAIN IT JUST LIKE SIMPLE ABCD.
Thanks for the lesson. Keep these coming!!
Brilliant.
This was such a great read for someone relatively new to Trading. Thank you so much for taking the time to lay this all out. My biggest takeaway (no surprise, ‘simple’)
Keep it simple, If you join the Trend when its at the beginning, Target 161.8% – 261.8 % – 461.8%
Thank you Master! (S)
Perfect guys. This has answered a lot of questions I wanted to ask but thought I had to learn for myself. With your help (and others) this space is slowly getting clearer day by day for me. Really grateful. 😀🕺🏻
I live for these articles … thank you 🙏
Simply Explained…… Love You… Trading Room…. Keep guiding us….
Quality Stuff. *Thumbs up*.
I appreciate the clarity of the concepts and the best trading practices, explained in a pedagogical and non-profit manner.
Thank you Trading Room, I am a fun.
Adrian
I am so appreciative to have found you guys! LOVE Crypto, but new to trading so been slow to take the leap into day trading. Now, that I have your educational tools accessible I feel more confident since I can comprehend your teachings. Thank you!!!!