Check: Trading Room Price Action Scanner here
What is Price Action Trading?
Price Action trading is a technique by which traders analyze the markets and then decide based on the price movements on the chart, as opposed to relying on lagging indicators. Most popular indicators are anyway derived from prices on the chart and are reflective of past price action.
Price Action Trading is all about taking your trading decisions from a naked price chart by stripping down the most complicated indicators. Price Action Traders generally don’t use most lagging indicators barring some key Moving Averages / Fib Levels, to identify dynamic Support and Resistance Levels. Most Price Action Traders follow the Price Action & Trail their Entry, Stops & Targets based on where the price is moving. One of the Hallmark of this strategy is, the Price Action Traders don’t rely on static price levels.
How Trading Room Price Action Scanner works?
The Scanner consists of two distinct Portions.
-
Trend Scanner
-
LIVE Fibonacci Scanner
The Trend Scanner helps detect Trends across 8 Timeframes for 300 Coin Pairs from Binance (Other Exchange Support will be added soon)
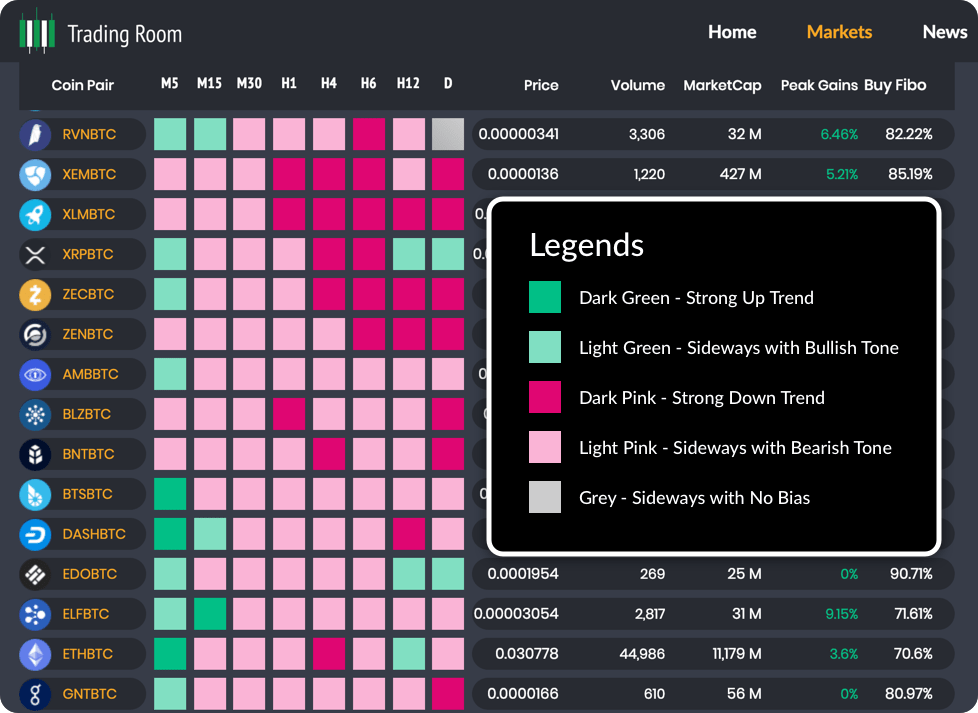
The Trend Scanner scans 300 Coins Pairs x 8 Time Frames = 2400 Charts in Real-time to identify the Trends & delivers the following output.
- Dark Green – Strong Up Trend
- Dark Pink – Strong Down Trend
- Light Green – Sideways with Bullish Tone
- Light Pink – Sideways with Bearish Tone
- Grey – Sideways with No Bias
Check the following Image to understand the color codes.
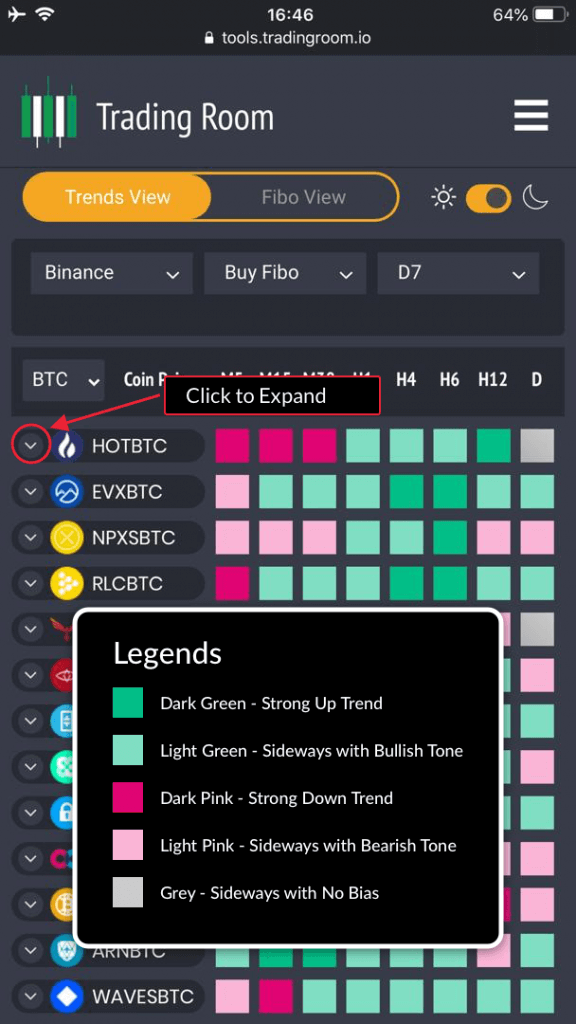
Different time-frames may throw different Trend Results. for Example, a coin may be in an uptrend in a larger time-frame but down trending in lower time frames or vice versa. The key is to identify larger trends/trend reversals early on and ride the trends on a local time frame’s pullback.
Who can use it?
The Price Action Scanner is meant to be used by Pro Traders as well as New Traders. Pro Traders will find it easy to use and help them save a lot of time. New Traders must learn Support Resistance Trading in order to more effectively use this. Join one of our upcoming LIVE Training Programs if you are New & looking to learn
Price Action Scanner – How to interpret Different Trend Combinations?
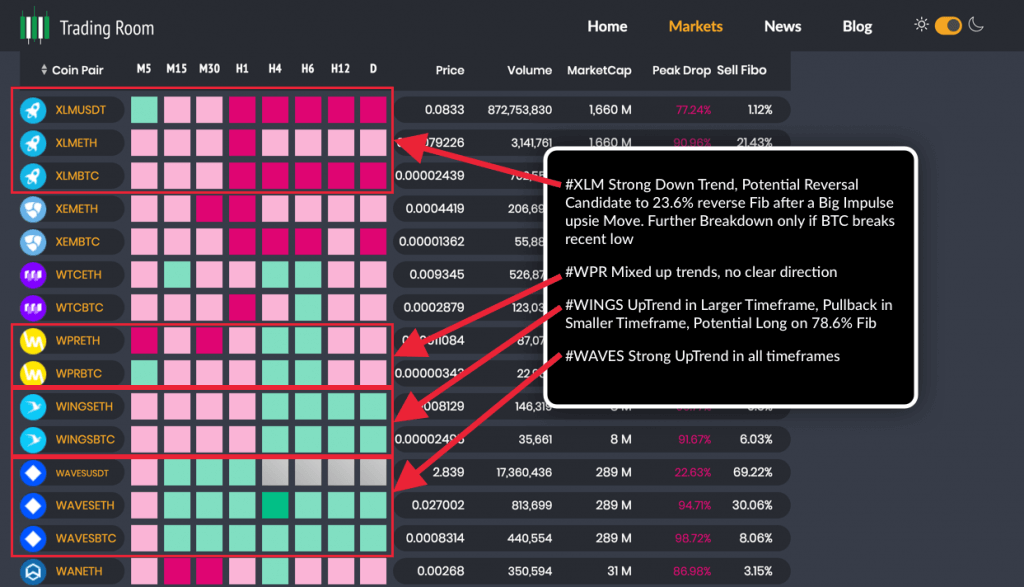
All Green in all time frames may indicate a Strong Up Trend in all time frames resulting in a large impulse move on the upside. This is only a probability and not a norm, but that’s a good enough indication to look for going Long on pullbacks based on Price Action. Off-Course a parabolic Up Trend also means Trend Reversal is likely. Looking at the Smaller Time Frame trends, you can easily identify when local time frames start reversing the Trend. Wherever possible, one can take the Trend Reversal SHORT position based on Price Action.
On the other side, All Pink in all time frames may indicate a Strong Down Trend resulting in further drops in the Asset’s Price. However, that can also mean, Price Reversal is around the corner if the Down Trend is exhausting. Trend Scanner helps you identify Strong Down Trending Assets. One can look for a SHORT on Pullback or Long on Exhaustion of the Trend based on Price Action Analysis (We will discuss Price Action below)
In a nutshell, The Trend Scanner helps you eliminate the need to check 8 different charts in order to understand Trends across different timeframes. You can get a Single View of what’s trending and in which time frame, thereby helping you save your time immensely.
We will be conducting LIVE Webinars to understand, How to Interpret & use Trend Scanner in Real-Time to identify Trade Setups. Please signup here for a Free Invitation. We have Limited Spots for the first batch, so the entry is on a first-come, first-serve basis.
What are LIVE Fibonacci Levels & how they work?
The heart of our Price Action Strategy is based on big impulse Moves & Pullbacks thereafter. We will not go into the details about “What is Fibonacci Retracement & how it works.” Our assumption is, You already know what Fibonacci Levels & How they work is. If you are new & do not have an idea about how Fibonacci Levels work, we will be conducting LIVE Interactive Training Sessions on the following Topics soon:
- Support & Resistance Zones
- What is Trend? & How to Trade Trends?
- Fibonacci Retracement
- Moving Average Crossovers
- Horizontal Support Areas
- RSI
- How to Trade Breakouts?
We will announce the dates for the LIVE Interactive Training soon. Now let’s move on. What are LIVE Fibonacci Levels & how they work?
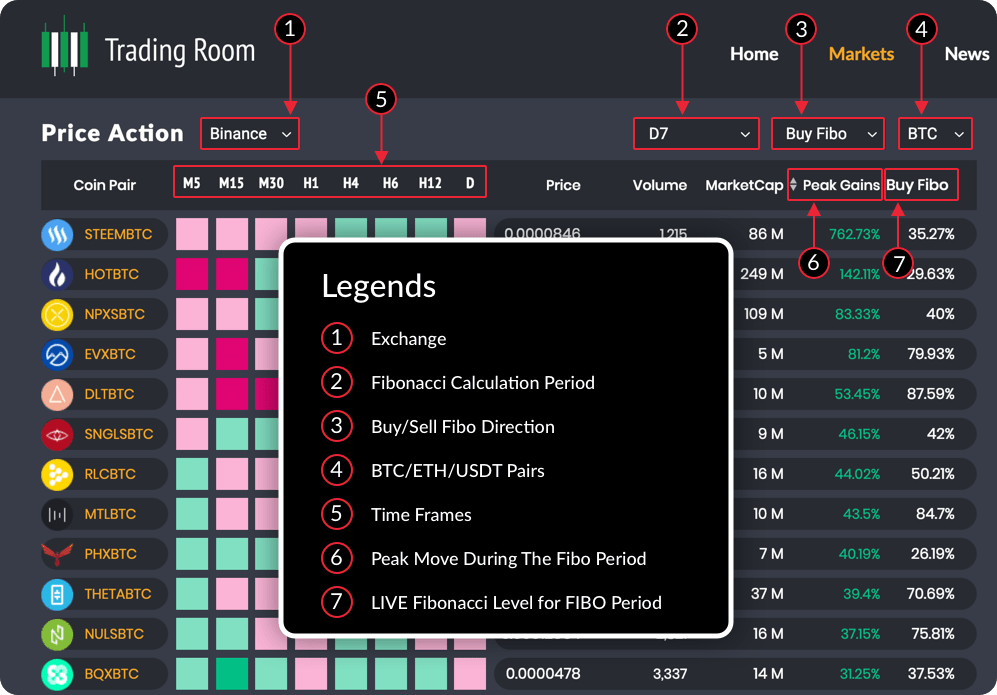
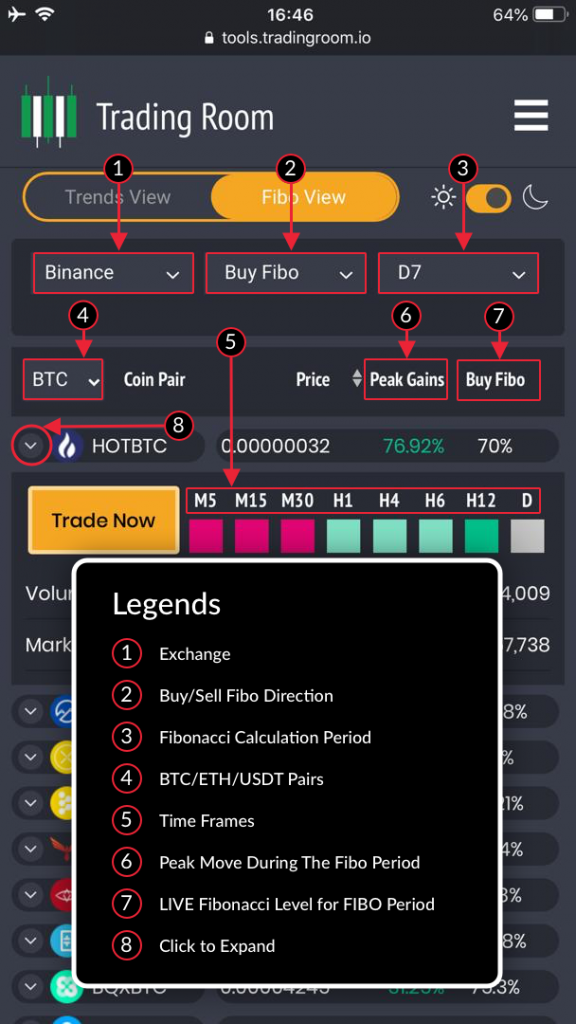
Price Action Scanner scans LIVE Fibonacci Levels for BUY Side & Sell-Side Price Action for 11 Time Periods spanning across right from 500 Days to 6 Hours. My personal favorite is 3 Days & 7 Days time period, but I also use 1 Day, 2 Day & 15 Days quite often. The LIVE Fibonacci Scanner gives you Real-Time Fibonacci Levels for Assets for that particular Time Period for both BUY & SELL Side.
For Example, when you check the 7 Days Period, you can see which assets have moved the most and what their current pullback level? Similarly, when you check 3 Days, you can check the Peak Movers in the last 3 days and their LIVE Fibonacci Levels.
With one Glance, you can track more than 300 coins x 11 Time Frames & view their LIVE Fib Levels. This allows you to save a huge amount of time as you can move straight to only those assets that have moved the most and offer a reasonable pullback entry. The Tool allows you to quickly also check Trends across 8 Time Frames for the same asset. Imagine you can identify the Top Movers in different Periods & their LIVE FIB level and scan their Trends in Real-time, all in Single VIEW. As is said, this is a game-changer innovation & patent filling is under active process for the same.
So you have the Trends, You have the Peak Movers & You have the Fib Levels. Now all you need is to open those charts, quickly assess them & setup your trades if you like what you see. However, to make your life easy, we will be conducting several rounds of LIVE Interactive Training Webinars. Click Here to Join the First Batch
Training will include the following:
What is Price Action Scanner?
How it works?
What do different Colours mean?
What is the Fibo Period?
What is BUY / SELL Fibo?
How to SORT Biggest Movers?
How to interpret different color codes?
How to identify Trade Setups?
What does the different Time frame mean?
How to define Entries?
How to identify Targets?
Where to place Stops?
How to identify Scammy Coins? How to identify Pump & Dump patterns?
Why MarketCap and Volume are important?
Before you join the Training, pls ensure to watch some YouTube videos on the following topics, so you can relate better:
- Support & Resistance Zones
- What is Trend?
- Fibonacci Retracement
- Moving Average Crossovers
- Horizontal Support Areas
- RSI
We are bringing the LIVE Training Program in Association with ChingasX; please read our announcement here.
I can promise you, your life will be much easier once you learn how to use the price action scanner and our other tools. Your everyday dilemma of what to trade today will disappear as you will have a clear direction, strategy, plan, and tools in place to identify good quality trade setups.
Register here for the first introductory Webinar
Send us your suggestions by email to feedback@tradingroom.io.
For Advertising & Sponsorship inquiries, pls contact advt@tradingroom.io.
Legal Disclaimer: All Information & Technical Analysis Modules are based on Proven Tech Analysis methods and strategies. However, as always, do your own research before taking any trading positions based on any online or social media posts, including ours.
This really does look like an incredible tool, thank you!
Much needed tool. MAny in one. Thank you
Waited long time for this amazing tool.
Appreciate your talent and will to teach!
Keep up the amazing job!
We want tools that can help us work smarter! This is certainly one of those tools.
BUY FIBO ZIL on Binance 90.93% ……….. 90.93% pf what? Is it (100%-90.93%) of difference between ATH and ATL plus ATL ?
The Buy Fibo is showing you the current retrace from Peak Gain during whatever Fibo Period you have selected. So from the Peak Gain it has lost 90%.
Sounds incredable. Hope it can help a newbee like me.
This will change how quickly you recognize trades across over 300 coins! Absolutely Fantastic!
Still trying to understand how it works. Signed up for the course already, but the browser needs to be refreshed I just noticed, maybe that’s how it works?
My main confusion is the Fib calculation period and the the “Buy Fib” level. If it’s daily and say at 78.6% retrace, where do I start the drawing? Looking forward to the webnair!
Great app! Thank YOU Tradingroom team.
Awesome value thank you kindly!
Thank you very much for doing this 🙂
Thank you for this. Wanting to do the webinar but timing not good (hospitals don’t close). Will be hopefully looking for a youtube recast on it. 🙂
This is amazing and will help a lot. Big thanks to you as for all your content!
God bless you guys, amazing tool and beautiful UI. Thank you so much
Great App, game changer trend scanner and amazingly its free – true to the TR brand !
The UI is quite good from a first launch perspective. Still need to learn how to use it effectively (subscribed to the webinar).
In terms of feedback to make the App even better :
1. A help/user guide (with link/url on top) which explains the basics of the App.
2. A “what’s this” icon on Buy/Sell Fib that links to the relevant section of the user guide.
3. The recorded webinar link available in the help/ guide section.
4. (For technical staff on the App) The UI doesn’t seems to auto-refresh on selection of BTC/USDT/All, doesn’t seem to be push server tech, seems the WebSockets functionality in SPA is not yet implemented (reckon its for a later phase). Should be prioritised!
Very nice stuff. Hope you keep going like this..
Wow!!! This is amazing so glad I ran into this. I can learn while making money. A real time saver. You guys are the best.
what is sell fibo And what is the difference between buy(up move ) fibo and sell fibo(down move ) ?
thanks for sharing
Hi,
So when the fib level on let’s say D7 chart says 30% it means that on the weekly timeframe (7 days) it has to pullback another 30% before it is ready to buy again?
Dear TradingRoom.io team,
I just want to let you know that looks like a price action scanner is not working. For example, ATOMUSDT price is the same I believe the third day or so. I hope everything is well and it will be back on track soon again.
Best regards,
David
It’s fixed